

A Practical Guide to Using a Vacation Rental Investment Calculator
Use our vacation rental investment calculator guide to forecast profits, cash flow, and ROI. Make smarter property investment decisions with confidence.
Disclosure: Some links in this article are affiliate links. If you make a purchase, we may earn a commission at no extra cost to you. This helps support our content.
A vacation rental investment calculator is your financial gut-check before you dive in. It’s a tool that takes all the inputs—the purchase price, potential income, and all those nagging little expenses—and gives you back the metrics that actually matter. Think of it as a financial crystal ball, offering a data-driven forecast of whether that dream property will be a cash cow or a money pit.
Why You Need to Run the Numbers Before Investing
It’s easy to fall in love with a charming cabin or a beachfront condo. But investing in a vacation rental is a serious business decision, not an emotional one. Before you get attached, you have to step back and look at the cold, hard numbers. This is where a vacation rental investment calculator becomes your single most important tool.
After managing properties from our 4-bedroom house in Washington, DC, to our beach places in the Riviera Maya, we've learned this lesson firsthand: passion fuels the dream, but data secures the investment. A solid forecast is what separates a profitable side hustle from a costly, stressful mistake.
The Foundation of a Smart Investment
Think of a calculator as the blueprint for your investment. It forces you to look past the beautiful listing photos and confront the real numbers that will make or break your success. The goal isn't just to see if a property can cover its own mortgage; it's to understand its true performance potential.
This means you need to get comfortable with a few core financial terms:
Gross Potential Income: The absolute maximum revenue your property could generate if it were booked every single night of the year.
Operating Expenses: All the recurring costs of keeping the lights on—utilities, insurance, cleaning fees, property management, you name it.
Net Operating Income (NOI): This is your gross income minus all those operating expenses. It's a pure measure of a property's profitability before you even think about the mortgage.
Cash Flow: The actual money left in your pocket each month after the mortgage and every other bill is paid. This is the number that really counts.
A great property in a great location can still be a poor investment if the numbers don't work. The calculator’s job is to tell you the unbiased truth, helping you avoid emotional decisions and focus on building a sustainable business.
The vacation rental market has seen significant growth. According to a 2024 report from Fortune Business Insights, the global market was valued at USD 174.84 billion in 2024 and is projected to hit nearly USD 396.93 billion by 2032. That's a massive opportunity, but only for investors who do their homework.
Understanding these metrics is step one. The next is figuring out how to actually pay for the property. A calculator is invaluable here, too—it lets you model how different loan terms will affect your bottom line. To help you navigate that world, we put together a guide covering the most common rental property financing options.
Ultimately, a calculator turns a hopeful idea into a data-backed strategy, ensuring you choose a path that aligns with your financial goals.
Gathering Your Data for an Accurate Forecast
A vacation rental investment calculator is an incredible tool, but it lives by one simple rule: garbage in, garbage out. The forecast it provides is only as good as the numbers you feed it. To get a truly realistic picture of your potential investment, you have to do some serious homework before you ever start plugging in numbers.
This all starts with your upfront costs. It’s way more than just the purchase price of the property. You have to factor in everything from closing costs and inspection fees to any immediate repairs or renovations you need to tackle. While you’re at it, dig into financing options, like understanding DSCR loans for short-term rentals and Airbnb properties, as these will shape your initial cash outlay.
Then comes getting the place guest-ready. From our experience furnishing our four-bedroom house, this can easily cost tens of thousands of dollars. And that’s before you even think about linens, kitchen supplies, and all the little decor touches that make a place feel special. Budget this out in detail—it's a massive one-time expense that heavily impacts your total initial investment.
Projecting Your Annual Operating Expenses
This is where so many new investors stumble. If you overlook or underestimate your recurring costs, your projections will be toast. We’ve learned the hard way to be brutally realistic here and always build in a buffer for the things you just can't predict.
Your checklist of ongoing expenses should be thorough. These are the costs required to keep your rental running smoothly day in and day out.
Property Management: Even if you plan to self-manage, account for the cost of software or, frankly, the value of your own time. If you hire a pro, you might pay 20-30% of your gross revenue.
Insurance: You'll need a specialized short-term rental insurance policy. This is completely different from a standard homeowner's policy, so don't get caught out.
Utilities and Subscriptions: This bucket includes electricity, water, gas, high-speed internet (a non-negotiable for guests), and any streaming services you offer.
Maintenance and Repairs: A solid rule of thumb is to set aside 1-2% of the property's value every year for this. On a $500,000 property, that’s $5,000 to $10,000 a year you need to have ready.
Consumables: Think coffee, toiletries, paper towels, and cleaning supplies. These small, recurring purchases add up faster than you’d think.
Researching Potential Rental Income
Once your costs are nailed down, it's time to figure out what you can actually earn. This has to be a data-driven process, not a guessing game. Relying on a gut feeling about what a place "should" make is a classic recipe for disappointment.
Start by digging into data platforms that specialize in short-term rental analytics. These tools analyze real booking data from millions of listings, giving you hard numbers on a market's performance. You can find everything from average daily rates (ADR) and occupancy rates to the revenue potential for properties just like the one you’re eyeing. For a deeper look at this, our guide on short-term rental analytics can help you sort through the noise.
Don't just look at the best-performing property on the block and assume you'll match it. We've found it's better to analyze the average and even the below-average performers. Grounding your projections in conservative, real-world data builds a much more resilient financial model.
We also make a habit of manually browsing listings on Airbnb and Vrbo. We'll look at the calendars of comparable properties in the area to get a real-time feel for booking pace and seasonal demand—a nuance that pure data sometimes misses. Combining robust analytics with this kind of on-the-ground research is our tried-and-true method for creating an income forecast we can actually rely on.
Projecting Your Potential Income and Occupancy
Alright, let's get to the fun part—figuring out what your property could actually earn. Your Gross Rental Income is the big number that everything else hinges on, so getting this right is key to getting a realistic forecast from your vacation rental investment calculator.
This whole projection comes down to two things: your Average Daily Rate (ADR) and your expected occupancy rate. You can't just guess here. You need to dig into the real-world performance of similar properties in your target market to land on numbers you can trust.
Understanding Market Dynamics and Seasonality
From our own experience managing properties in beach towns like Playa del Carmen and Tulum, we learned a long time ago that seasonality is everything. What a place earns in March during spring break is a completely different story from its income in September during hurricane season. A simple annual average just won't give you the full picture.
You have to break down the year into at least three distinct periods:
High Season: This is when everyone wants to travel. Demand is through the roof, and you can command your highest rates.
Low Season: The slowest months of the year, where you should expect both lower rates and occupancy.
Shoulder Seasons: These are the sweet spots in between, often offering a great balance of steady demand and solid pricing.
By forecasting your ADR and occupancy for each of these seasons separately, you can build a far more accurate and reliable annual revenue projection. It's a bit more work, but it's worth it.
Using Data to Ground Your Projections
Guesswork has no place in a solid investment analysis. To find reliable data, we lean heavily on market intelligence tools that crunch the numbers on millions of listings.
For example, here’s a look at the kind of data you can pull from a platform like AirDNA, showing key performance metrics for a specific market.
A snapshot like this gives you a data-driven baseline for ADR and occupancy, moving your estimates from a gut feeling to an informed projection. It’s a critical step to make sure your numbers are grounded in reality, not just wishful thinking.
But don't stop there. We always recommend doing some old-fashioned manual research. Hop on Airbnb and Vrbo and scout out listings that are truly comparable to yours. Look at their calendars to see how booked they are for the next few months and study their nightly rates. This "on-the-ground" research helps validate the data and can reveal little nuances that broad market reports might miss. Our guide on the best short-term rental markets can give you a head start on what to look for.
Don't forget to block off time for yourself! We always schedule a few weeks for our own vacations and another week or two for deep cleaning and maintenance. Factoring this in from the start keeps your income forecast realistic by accounting for planned downtime.
This approach is crucial in a growing market. A 2024 analysis by Towards Data Science noted that the vacation rental market was valued at around USD 94.45 billion in 2024, and it's expected to climb to USD 134.26 billion by 2034. This growth is increasingly driven by online bookings, which rely on technology to help hosts like us optimize our pricing and profitability.
Understanding Your Key Performance Metrics
Once you've plugged all your income and expense data into a vacation rental investment calculator, it will spit out a few key numbers. These aren't just figures on a screen; they're the vital signs of your potential investment, telling you exactly how hard your money will be working for you.
Making sense of these results is what separates hopeful buyers from confident investors. Three metrics, in particular, will give you the clearest picture: Capitalization Rate (Cap Rate), Cash-on-Cash Return, and Return on Investment (ROI).
This infographic gives you a quick look at the core income drivers that feed right into these calculations.
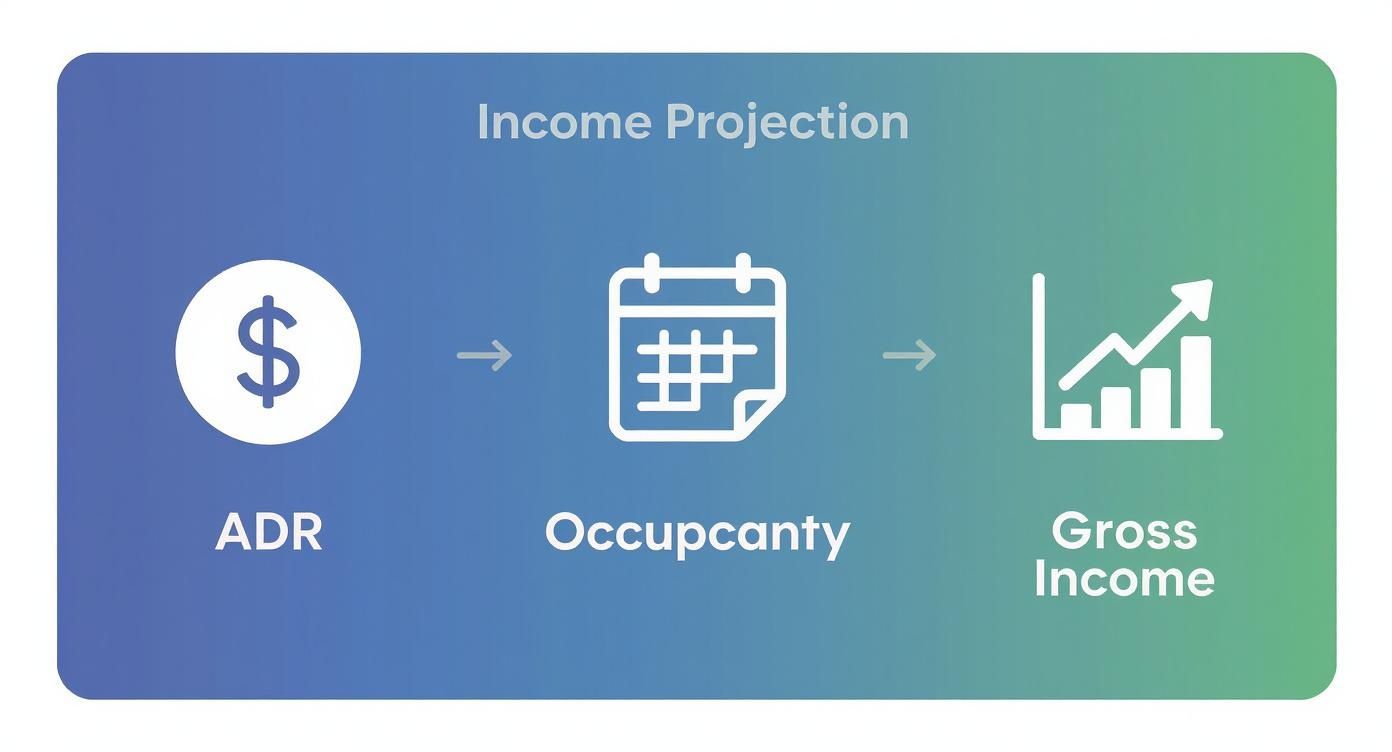
These three inputs—your ADR, Occupancy, and the resulting Gross Income—form the foundation of your entire profitability analysis. Get these right, and you're already halfway there.
Capitalization Rate (Cap Rate)
Think of Cap Rate as a way to measure a property's raw, unleveraged earning power. It completely ignores your mortgage, giving you a clean way to compare different properties on an apples-to-apples basis. It's calculated by dividing your Net Operating Income (NOI) by the property's purchase price.
What it tells you: How much profit the property generates relative to its price, regardless of how you finance it.
Why it matters: It’s perfect for quickly sizing up multiple deals to see which one offers the best fundamental return before financing even enters the picture.
Cash-on-Cash Return
While Cap Rate ignores financing, Cash-on-Cash Return puts it front and center. This metric is all about the performance of your actual cash investment—your down payment, closing costs, and furnishing expenses. It’s your annual pre-tax cash flow divided by the total cash you put in.
For us, this is the number we watch most closely. It tells us how effectively our down payment is generating real, take-home profit each year. When you hear investors talking about getting a 10% or 12% return, they're usually talking about cash-on-cash.
A property might have a modest Cap Rate of 6%, but if you secure great financing, your Cash-on-Cash Return could jump to 12% or more. This is why understanding both metrics is so important—they tell you different parts of the same story.
Return on Investment (ROI)
Finally, there’s the big one: Return on Investment (ROI). It's a fundamental part of any investment analysis, and knowing how to calculate Return on Investment (ROI) is essential for gauging true profitability. This metric gives you the most complete view by looking at your total return (cash flow plus equity gained from loan paydown) relative to your initial cash investment.
It combines two key wealth-building components:
Cash Flow: The money in your pocket each year.
Equity Growth: The portion of your mortgage payments that builds your ownership stake.
ROI offers a long-term perspective on how your investment is performing. According to 2024 AirDNA data, global short-term rental supply grew by 9%, with traveler demand for larger homes also on the rise. A good calculator helps you model how these trends might impact your long-term ROI.
Of course, mastering these metrics is only half the battle. You also have to manage the costs that influence them. You can learn more by reading our guide to understanding the true property management cost per month.
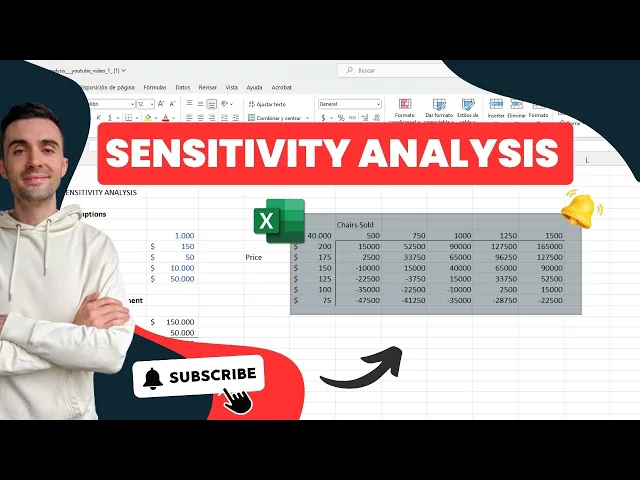
Fine-Tuning Your Strategy in a Spreadsheet
Your vacation rental calculator gives you the hard data, but a truly sound investment is built on strategy. Think of that initial analysis as your starting line. The real magic comes from stress-testing your own assumptions.
We call this sensitivity analysis, and it’s the process we lean on to brace for the unpredictable. What happens to your cash flow if a slow season gets even slower and occupancy dips by an extra 10%? What does a tiny bump in mortgage rates do to your annual return? Running these "what-if" numbers is absolutely critical.
Modeling Real-World Scenarios
For any property we’re seriously considering, we map out a few different potential futures. This isn't about being a pessimist; it's about being prepared. When you understand the full spectrum of possibilities, you can walk into a deal with your eyes wide open.
Here’s how we typically break it down:
Best-Case Scenario: This is the fun one. What if demand is stronger than you project and you're consistently booking at top-tier rates? This paints a picture of the property's maximum upside.
Worst-Case Scenario: Think of this as your financial fire drill. Model a serious drop in occupancy or a major, unexpected expense like a new HVAC system. Can the property survive without forcing you to drain your savings?
Most-Likely Scenario: This should be your baseline, grounded in conservative data from tools like AirDNA and your own boots-on-the-ground market research. This is the projection you should anchor your decision to.
Running these scenarios does more than just prepare you for risk; it often reveals hidden opportunities. You might discover that even in a worst-case situation, the property remains a solid long-term hold, giving you the confidence to pull the trigger.
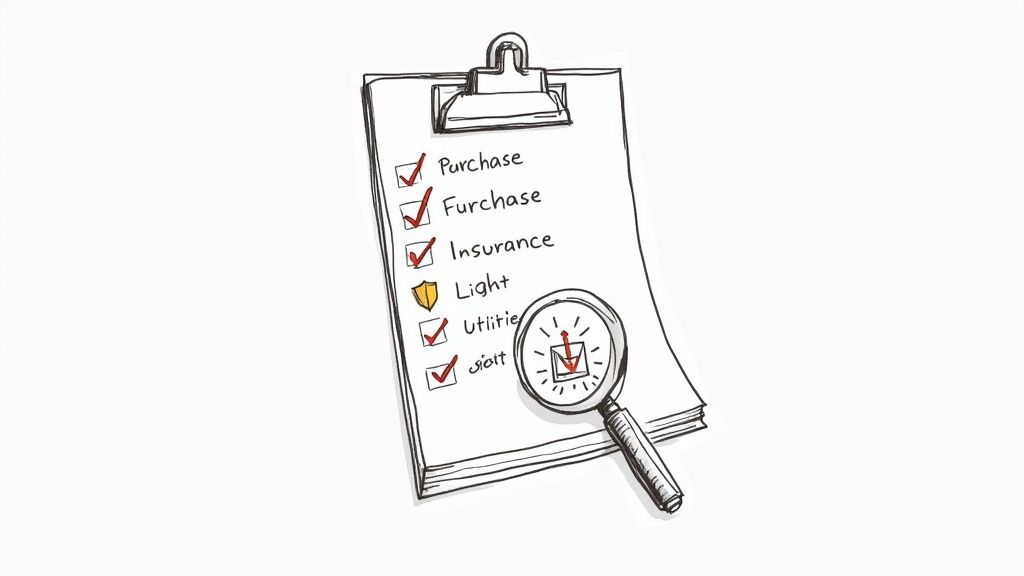
Looking Beyond the Spreadsheet
Numbers tell a huge part of the story, but they don't tell all of it. A fantastic Cap Rate means next to nothing if the local city council is on the verge of banning short-term rentals. This is where your due diligence has to move beyond the calculator.
Before we even think about making an offer, we dig into several crucial non-financial factors:
Local Regulations: Are there caps on the number of nights you can rent per year? Are permits required, and is the process difficult to navigate?
Market Saturation: Take a hard look at how many other rentals are in the immediate area. A flood of new listings can put serious downward pressure on your rates and occupancy.
Economic Outlook: Is the area's economy on an upward trend? Are new attractions, businesses, or employers coming to town that will drive tourism for years to come?
This is just our way of doing things, but this holistic approach helps ensure we're not just buying a property with good numbers, but a sustainable business in a location with a bright future. At the end of the day, a strong location and savvy promotion are what keep the bookings rolling in. For more on that, check out our guide on creating a powerful vacation rental marketing strategy.
Got Questions About Vacation Rental Investing?
Investing in short-term rentals always stirs up a lot of questions. After more than a decade in this business, we've heard just about all of them from fellow hosts and people just starting out. Here are our takes on a few of the most common ones we get about running the numbers.
What Is a Good Cash-On-Cash Return for a Vacation Rental?
This is probably the number one question, and the honest answer is: it depends.
While many investors aim for a cash-on-cash return between 8% and 12%, there really isn't a single magic number that fits every situation. In a market that's appreciating quickly, you might be thrilled to accept a lower initial return of 5-7%. Why? Because you're banking on long-term equity growth to boost your overall ROI down the road.
From our own experience, our properties in stable, established markets have consistently delivered around 10% returns year after year. On the flip side, some of our investments in up-and-coming areas started with weaker cash flow but have seen their property values climb significantly.
It’s less about hitting some universal benchmark and more about finding a return that lines up with your personal financial goals and how much risk you're comfortable taking on.
How Do I Accurately Estimate Maintenance Costs?
Underestimating maintenance is one of the fastest ways to torpedo your projections. It's a classic rookie mistake. A common rule of thumb is to budget 1-2% of the property's purchase price each year. So for a $400,000 property, you should be setting aside $4,000 to $8,000 annually for upkeep and repairs.
Another practical way we've found to look at it is to allocate 5-10% of your gross rental income specifically for maintenance. Vacation rentals get a lot more wear and tear than long-term rentals, so we always advise leaning toward the higher end of these ranges.
We actually make it a practice to open a separate savings account just for these funds. That way, you’re never caught off guard by a major expense, like a new AC unit failing in the middle of a July heatwave.
A spreadsheet can definitely work if you're comfortable building it out. The main benefit of a pre-built vacation rental investment calculator is that it already includes all the necessary formulas and expense lines, which dramatically reduces the risk of overlooking a critical cost. It’s a great safety net, especially for new investors.
For most hosts starting out, a dedicated tool ensures you're covering all your bases without having to become a spreadsheet wizard overnight. It’s about using the right tool for the job to make a confident, data-backed decision.
Running the numbers is the first step to building a great business. The next is creating an amazing guest experience that keeps people coming back. At SmoothStay, we're hosts who build tools for other hosts. Our customizable digital guidebooks, powered by guest-first AI features, help you answer questions proactively and earn more 5-star reviews. Start your free 14-day trial today and see the difference a seamless stay can make.

